
Debugging
Has your code always produced the results that you were expecting? Probably not. Eventually, you will find a problem and will want to know exactly what Godot is ‘thinking’. What did it do with a particular value? Where did it go? Why didn’t it run your function? Why is it stopping? Etc. To understand these things, you need to be able to stop the program in the middle of running and examine it. This is the art of debugging. Debugging is an important skill that makes programming faster and less frustrating.
Please read this short tutorial on debugging. Then, try these things:
Set a breakpoint in the for loop in func _draw
Step through the program by using the F11 key
Find the value of h and h1 while the program is paused
Continue running the program after stopping it with the F12 key
Let’s build something animated.

Start new project
Open Godot and use the Project Manager to create a New project. Name it Lesson4 and put it in a folder you create, called Lesson4. Click on 2DScene. Node2D will work for a root node. Create a script for Node2D, which you can leave as Node2D.gd.
Make a big array of numbers under the _ready() function. We will write this to a file.:
var narray = []
	for i in range(100):
		narray.append(randf()*60.0+70.0) #random float numbers
File Functions
You should have a file, “File Functions.gd”. This is a gd script with various ways to write an array to a file, and to read them. The ones we will use are writecsv() and readcsv(). Add them to your code, below the _ready function.
writecsv()
func writecsv(filename, array):
	print("--csv---")
	#NOTE: This converts the array to string type!
	var file = File.new()
	var error = file.open(filename, File.WRITE)
	if error == OK:
		#all stored at once, and converted to strings
		file.store_csv_line(array)
	else:
		print ("Error opening file")
	file.close()
Explanation:
For this function, we pass in a filename, like “user://datacsv.dat”, and an array, like [1,2,3,4,5]. We tell Godot that we are writing a file, by using the File.new() function, and we assign it to a new variable, ‘file’. Then, we try opening the file, telling Godot we want to ‘WRITE’. If there were a problem, e.g. the file is open already, it will produce an error. In our writecsv() function, we just check if it is OK. [Note the use if ‘==’ which is to check if something is identical. If you use ‘=’ in an ‘if’ statement, Godot will give an error. ] So, if it is OK, Godot has a function it can use on ‘file’ called ‘.store_csv_line’. It writes the entire array, no matter how long, at once, on one line. If there were an error, it would print “Error opening file.” We end by closing the file.
readcsv()
func readcsv(filename):
	var file = File.new()
	var error = file.open(filename, File.READ)
	var data = []
	if error == OK:
		data = file.get_csv_line()
	else:
		print ("Error opening file")
	file.close()
	return data
Explanation
This is all the same as the writecsv() function, except we want to ‘READ’. And we will read the whole csv file, expecting it to be all on one line. We have to specify that it is an array by making data=[] before getting the data with .get_csv_line. We use ‘return’ to send the the array back to the code that calls this function.
Now, let’s call our function to write the big array inside the _ready function.
writecsv(“res://datacsv.dat”, narray)
Run your app. Godot will write this file in your project folder. Open your project folder. Find this file. Open Notepad. Drag this file into Notepad.
Tip:
If you need to read or write to a file, this might be useful:
The Essential Guide to Godot Filesystem API | davidepesce.com
About File Locations
Godot can write files to, and read them from, two locations.
It can write to the project folder when you are developing your program. It may not be able to write there when you distribute your program. It can read from this folder, probably. If you are going to write or read from your project folder, use this location “res://”.
It can write to your user data folder for Godot. This is apparently a safer place to write data. The user’s system will probably allow this. It can read from there also. If you want to write or read from the user’s data folder for Godot, use this location: “user://”. The user folder is not obvious on a particular computer. On my computer this is the full path to the data file we will create in this lesson:
“C:\Users\warin\AppData\Roaming\Godot\app_userdata\FileFunctions\datacsv.dat”
Because this may not be easy for you to find the file you create in this project, we will write and read to “res://datacsv.dat”
Create a button as a child of Node2D, called ‘playbutton’. Use the Node tab for it to connect ‘pressed’ to a function.
Create this function:
func _on_playbutton_pressed():
	dataarray = readcsv("res://datacsv.dat") #can read this even though it isn't in FileSystem
	dataarraylen = len(dataarray)
	print(dataarray)
Run your app and test the button. You should get a large array of numbers in the Output area of your Godot interface.
Dials, gauges
Godot is a game engine and so we should take advantage of it to be creative and animate things on the screen.
First, let’s add a CanvasLayer. This will be necessary because we want to lower the Layer to -1 so we can draw on our background bitmap.
Add CanvasLayer as CanvasLayer as a child to Node2D. Change the Layer property to -1 in the Inspector dock.
Add a TextureRect as a child to CanvasLayer. Load the ‘background.png’ bitmap, size 1915×925 to the Texture property. Change the size to match the size of the bitmap.
Add a sprite as a child to Node2D, and load the texture, ‘dial.png’. Change the name of the sprite to ‘dial’.
Add a sprite as a child to ‘dial’, and name it ‘needle’. Load the texture, ‘needle.png’.
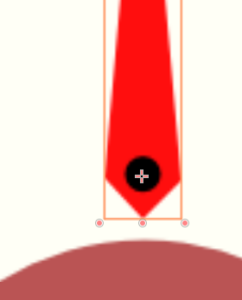
Carefully position the needle so that the black dots on the dial and needle overlap.
Go to the toolbar of Godot and you should see an options that says ‘Click to change the object’s rotation pivot.’ Click this and the cursor should allow you to move the tiny plus sign of the needle to down to be in the center of the needles black dot. Like this:
At this point you can try rotating the needle by selecting Rotate Mode by using the ‘E’ key. If you do this, you can see it’s rotation_degrees changing in the Inspector dock, if you use ‘Expand Properties’.
Let’s add one more node, an HSlider as a child of Node2D. For it’s properties, let’s change Max Value to 1, and Step to 0.01.
Go to the Node tab in the Inspector dock for the HSlider. Connect the HSlider’s event, ‘value_changed’. It will create a new function. Under this function, add the following:
func _on_HSlider_value_changed(value):
	var mindialdeg = -80.5
	var maxdialdeg = 80.5
	var degr = value*(maxdialdeg-mindialdeg)+ mindialdeg
	$dial/needle.rotation_degrees =degr
Run the app. Move the slider and the needle should move.
Explanation:
‘mindialdeg’ is my approximation of how many degrees to the left the needle should be allowed to go. ‘maxdialdeg’ is the same thing for moving the needle to the right.
‘value’ is generated by the slider itself, when you move it. ‘degr’ is my conversion of ‘value’ (which is 0 to 1) to degrees between -80.5 and 80.5.
The last line talks to dial and then to it’s child needle, and changes the rotation_degrees property to ‘degr’.
Playback of data
Let’s try to make a way to read in the data made earlier and saved to file, and then create an animated graph, where we see the graph created.
Let’s add a couple of buttons as children of Node2D, and name them ‘playbutton’ and ‘stopbutton’. Connect their ‘pressed’ property and go to the code. Enter this code:
func _on_playbutton_pressed():
	pass # Replace with function body.
	dataarray = readcsv("res://datacsv.dat") #can read this even though it isn't in FileSystem
	dataarraylen = len(dataarray)
	print(dataarray)
Explanation:
If you run the app, you should get a see in Output, large array that has been read in via the csv file you created earlier.
Add this to the top, above _ready(). We need these for some variables we want to share between functions:
					var datanum = 0
var datarraylen = 100
var dataarray = []
Next, let’s set up some animation. For that, we need a Timer.
Add a Timer as a child to Node2D. Change the Wait Time to 0.2 (sec). On the Node tab, connect to the timeout() event. You are back in the script.
And, here is the timer function:
func _on_Timer_timeout():
	pass # Replace with function body.
	datanum += 1
	var mindialdeg = -80.5
	var maxdialdeg = 80.5
	if datanum == dataarraylen:
		$Timer.stop()
		$dial/needle.rotation_degrees = mindialdeg
		datanum = 0
		return
	var value = float(dataarray[datanum]) #the csv file is now text values
	var vfraction = value/200.0 #200 is maxvalue
	var degr = vfraction*(maxdialdeg-mindialdeg)+ mindialdeg
	$dial/needle.rotation_degrees =degr
Explanation:
First, datanum is being incremented by 1. I could have used: datanum = datanum +1, but I’m doing it the shorthand way with datanum +=1. Means the same thing.
Then, most of the next lines should look familiar from the HSlider function.
I added the ‘if datanum==dataarraylen’ because otherwise the animation occurs, then crashes when we go past the end of the data. ‘$Timer.stop’ causes the animation to stop, because after this instruction, the Timer can’t time out anymore. I reset the needle to zero. The ‘return’ here is because I don’t want to perform the subsequent actions if my data has already run out.
If you run the app, the needle should move around as the data is played through.
You can make this stop, by connecting ‘stopbutton’ to the pressed event and fixing that function to:
func _on_stopbutton_pressed():
	pass # Replace with function body.
	$Timer.stop()
Bar chart
We can animate the creation of a bar chart, too. I’ll just draw the bars, one at a time with the value of the data array.
Add this code to draw the bar graph:
					func _draw():
	for i in range(datanum):
		var col = Color("660000")
		var x = 850 + i* 10
		var h = 710-float(dataarray[i])*710.0/160.0
		var rect1 = Rect2(Vector2(x, 710-h), Vector2(9, h))
		draw_rect(rect1, col)
Explanation:
I’m going to draw the whole bar graph only up to the ‘datanum’ which, you may recall, is being incremented by 1 every time the Timer times out. The values x and h are pixels. I am filling h by converting the value of each of the dataarray values to pixel units. I am filling x by evenly-spacing my bars every 10 spaces.
Under the Timer function, be sure to add update() at the end so you can keep redrawing the bars for the animation.
Digital Readout
Let’s add a digital readout of the same information that is being displayed on the dial and needle.
Create a Label, named ‘digital’. Make the formatting nice with a custom font, as you did in Lesson 2. Add a Sprite, named digitalbackground, and load the texture, digital.png. Move it behind the ‘digital’ label and make it look nice. Add this under the _on_Timer_timeout() function:
$digital.text = str(stepify(value, 0.1))
Stepify is very handy to format floats to whatever number of digits you like.
Progress Bar
Create 2 new sprites, ‘progressbar’ and ‘progressbarback’. Load the textures ‘progress.png’ and ‘progressbararea.png’ . ‘progressbarback’ goes on top of ‘progressbar’. Notice you can change the Scale of x and y in the properties of ‘progressbar’. That’s what we are going to do in this code, which goes also under the _timeout function.
$progressbar.scale.x = float(datanum)/float(dataarraylen)
This is how you can show progress as Godot displays counts up datanum from 0 to 200.
Create a line on the bar chart showing the running average using this code:
					Average = [] #This goes at the  top, above _ready().
func stats():
	var sum = 0.0
	for i in range(datanum):
		sum += float(dataarray[i])
	average.append(sum/datanum)

func _draw():
	for i in range(datanum):
		var col = Color("660000")
		var x = 850 + i* 10
		var h = 710-float(dataarray[i])*710.0/160.0
		var rect1 = Rect2(Vector2(x, 710-h), Vector2(9, h))
		draw_rect(rect1, col)
		stats() #call to get a running average
		var h1 = 710-average[i-1]*710.0/160.0
		var h2 = 710-average[i]*710.0/160.0
		if i>0:
			draw_line(Vector2(x-10, 710-h1), Vector2(x, 710-h2), Color("ffffff"),3, true)
Creating Your Own App
You have the information now to build a nice app with features such as:
Data entry and display
Controls such as sliders and buttons
Drawn lines and rectangles
Animated objects
Reading and Writing to files
Try creating a New Project and just be experimental. See how many of the things we have covered you can include in your project, even if it they are not necessary.
Also, think about what sort of simple app you would like to make that might be useful. Lessons 7&8 will be to help you build your own app.