Let’s make an interactive graph.
Set up the project
1. Create a new project, call it Lesson3 and put it in a new folder, Lesson3. Click on 2D Project in the Scene dock area. You should now have a root node called Node2D.
2. Create a bitmap 1915×925 with a graph area and axes titles. You can use this one, if you are not ready to make one.
3. Go to the menu, Project Settings. Search for Window, under Display. Change the width to 1915 and the height to 925. Scroll down and find the Stretch, Mode and make it 2D, and the Aspect, to ‘keep’. Close the project settings. If necessary, to see the light purple project area, zoom out (scroll wheel or Ctr+’+’, or Ctrl+’-‘) and pan to center your project (hold middle mouse/scroll wheel down, or select the ‘hand’ in the upper middle-right by using the ‘G’ key. Get back to select mode by using the ‘Q’ key.
4. Add a child node CanvasLayer. The CanvasLayer node can be moved earlier in the draw order. To do this click on CanvasLayer and then in the Inspector dock, change the Layer property to -1.
Adjusting the layer is only necessary because we are going to have Godot draw our graph and it normally draws on Layer 0, so it will be hidden unless we lower the CanvasLayer which will then lower the child TextureRect in step 5.
5. Add a child node TextureRect to the CanvasLayer node. Rename this ‘background’. For the Texture property, load your bitmap from step 2.
6. Click on Node2D in the Scene dock. Right-click and Attach Script. Use the default name, Node2D.gd. Open the script using the small scroll icon next to Node2D or double-click Node2D.gd in the FileSystem dock in the lower left.
7. You could have Godot draw the graph axes, but I have drawn them in my bitmap, along with the axis labels, which is a bit easier since they won’t change inside this app. But since I have drawn them, I have written down the values from my drawing program: the location of have my graph origin at the pixel location of 458, 788, and my graph area is 1000 pixels wide x 650 pixels tall.
Get data ready for plotting
8. Create some data for plotting. We can do this when the program first starts up, which is inside the _ready() function. Let’s plot pressure vs rate for a pipe with a downstream pressure of 100 psi. And an upstream pressure that increases at rate squared. Here’s the formula: pressure = C*rate^2 + 100. An analysis shows that C for this pipe is 0.57.
Here is the code, explanation below:
					var numpoints
var pressure = []
var rate = []
var xpx = []
var ypx = []
func _ready():
    numpoints = 21
    for i in range(numpoints): #this will return 20 values from 0 to 20
        var r = i
        rate.append(r)
        var p = 0.57*pow(r,2)+100.0
        pressure.append(p)
Explanation:
First, before the _ready() function, we need to make some variables to share between functions. The _draw function doesn’t have a way to allow us to pass values into it. We have to at least pass the pixel values we need for plotting, so I have made xpx and ypx to hold these.
Inside the _ready() function, let’s populate the variable, numpoints, to hold the number of data points we will create.
Next, we use a for loop. In this example, we use ‘i’ just to hold the index of the arrays we will create. ‘range’ is the way we say how to count. In GDscript, like python, arrays always start with zero. So, a 21 member array will go from zero to 20. In this simple example, I made a variable ‘r’ just to hold the rate, which in this case is just ‘i’, but this way, I can add a multiplier to i to get a different r value, if I want to later.
I made a formula for pressure’s relationship to rate. In that relationship, pressure goes up at the square of the rate. The function pow(number, power) is used to raise a number to a power. In this case, I want to raise r to the power of 2 (which is what I mean by ‘square’). I added a factor 0.57 to describe the relationship for this particular pipe. And because of the downstream pressure is 100, I add 100.
Note: I use ‘100.0’ and not ‘100’ here in the calculation of ‘p=’. The reason is that otherwise I might end up with integers and they can round off numbers incorrectly. If you divide two integers, Godot might expect the answer to also be an integer, and it will give the wrong answer. If I divide two integers like, 7 divided by 4, you probably want the answer to be 1.75, but Godot will decide you want an integer, so it will give calculate the integer 1. If instead you divide 7.0 by 4.0, Godot will give you the right answer, 1.75. By using 100.0 which is a float, that forces p to be a float, and thus the pressure array will hold floats.
rate.append(r) is how to add values to the empty rate array. I do the same for the pressure array, using pressure.append(p).
Note: I keep using the term ‘array’, which is correct in describing the math, but there are arrays and lists in python and GDscript. I’m using lists, which are more flexible than arrays.
Now, the data has been created for the graph.
9. Convert the data into pixel arrays. In the _ready function, I added this:
    var maxx = rate.max()
    var maxy = pressure.max()
    #find conversions of rate and pressure to pixels
    var pixelswide = 1000 #the area of plot is 1000 x 650 pixels
    var pixelstall = 650
    var xoriginpixels = 458  #the origin is 458,788 pixels
    var yoriginpixels = 788
    var scalex = pixelswide/maxx
    var scaley = pixelstall/maxy

    #loop over rates and pressures and calculate pixel positions
    for i in range(len(rate)):
        var x = xoriginpixels+rate[i]*scalex
        var y = yoriginpixels -pressure[i]*scaley #negative here because graph is y increasing up, but pixels are y increasing down.
        xpx.append(x)
        ypx.append(y)
Explanation:
I want to find the maximum x and y values so that I can scale the graph well. That’s why I create variables maxx and maxy.
The size of my plot in pixels was defined when I made my bitmap. Also the same for the origin of the graph.
So, I have included pixelswide and pixelstall to describe the size of the plot area, and xoriginpixels, yoriginpixels to describe the origin of the graph.
Then, scalex and scaley are going to be my conversion factors from rates and pressures to pixels.
Finally, I made a for loop to calculate the x and y value for each corresponding rate and pressure value, then I put these into the xpx and ypx arrays which will hold them to for the drawing function.
Plot the graph
10. Now we need to draw our lines. Godot will draw these lines once using a special function called _draw().
func _draw():
    pass
    var col = Color(0,0,0,1)
    for i in range(len(xpx)-1):
        draw_line(Vector2(xpx[i], ypx[i]), Vector2(xpx[i+1], ypx[i+1]), col, 5, true)
Explanation:
This is very simple. First, we need to assign a color. That’s the col= line. That color is in RGB+alpha format. Here is more information and a lot of color values.
Godot will draw this once. If you want to change the values and draw it again inside the program, call the ‘update()’ function.
Here is what you should have as a result:
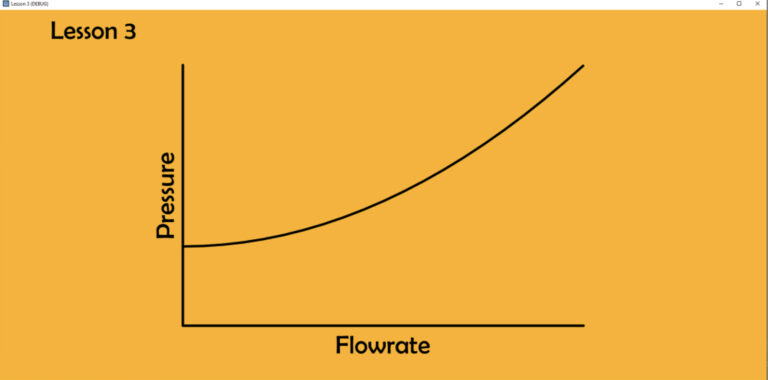
You can draw other lines, and just use a different Color and/or thickness.
Tip: In case you want to draw column bar graphs, this is how to draw a rectangle, at pixel location of x, height of ‘h’ (where the bottom is at pixel location 710), with a thickness of 7, with color of ‘col’:
var rect1 = Rect2(Vector2(x, 710-h), Vector2(7, h))
draw_rect(rect1, col)
Create some interactive data points
This graph is very simple, but it would be nice to show some points and give them values when we hover over them. So far, we have manually created all the nodes that are on the screen, but that will get overwhelming if we have lots of nodes, and especially if we want to do similar things with them, like position them. Let’s see how we can create scenes, automatically. Those automatically generated scenes are called ‘instances’.
11. You need a tiny bitmap for the datapoint. I created a tiny 24×24 bitmap, datapoint.png. You can download it here.
12. Create a New Scene. This will be created just for the datapoint. The root can stay as Node2D. Add a child, TextureRect. Load the Texture property with with datapoint.png. Change the position, Rect, of TextureRect to -12, -12. This will make sure your datapoint.png is centered well on your graph curve. Save that scene and call it datapoint.tscn. You should see it show up in the FileSystem dock in the lower left.
13. Go back to the Node2D in our main scene (the one with the graph). Go to the Node2D.gd script.
14. Above the _ready function, add another variable var datapointarray = []
15. Back at the bottom of your script, add some code to make a new function:
					func makedatapoints():
    var datapointscene = load("res://datapoint.tscn")
    for i in range(numpoints):
        var datapointinstance = datapointscene.instance()
        add_child(datapointinstance)
        datapointarray.append(datapointinstance)
16. Add makedatapoints() to the _ready function, or else Godot will not have an event that tells your new function to run. Try running the app and you should see a datapoint in the upper left corner.
Explanation:
I made a new function I called makedatapoints(). To create an instance that we can manipulate we have to:
a) Load the resource from the FileSystem into a scene.
b) Create an instance of that scene with is a two step process:
1. Use the .instance() method on the scene we just loaded
2. Add a child of that instance
c) That will make the instance, but to find it and manipulate it again, we have to add it to an array with the .append() method.
17. Add one more function, in order to populate the instances with data and move them around, and otherwise manipulate them:
					func populatedatapoints():
    pass
    for i in range(numpoints):
        var tmp = datapointarray[i]
        tmp.position.x = xpx[i]
        tmp.position.y = ypx[i]
        tmp.get_node("TextureRect").hint_tooltip  = "Rate: "+str(rate[i])+", Pressure: "+str(pressure[i])
18. Add one more line to the _ready() function: populatedatapoints() so this new function also runs.
Explanation:
I made another function populatedatapoints(). I’m iterating over the same array I created in makedatapoints(). This time, for each point, I will change certain properties. First, I make a temporary variable to hold each element of the datapointarray. Then I change its position in the x and y coordinates. Good thing I made those handy arrays of pixel locations for the datapoints already. Technically, I’m changing the Node2D transform .position property inside the datapoint.tscn scene because it is the root node of that scene.
Finally, I add some text to the .hint_tooltip property. But, I can’t just add it to the datapoint scene because Node2D in the datapoint.tscn scene does not have a hint_tooltip property. I want to add it to the TextureRect, the child below Node2D in the datapoint.tscn scene. To find that, I use the get_node() function, on the scene, to get the TextureRect node that I know is there. Then, I change the tooltiop of each one of these instances to the correct rate and pressure text string, I create.
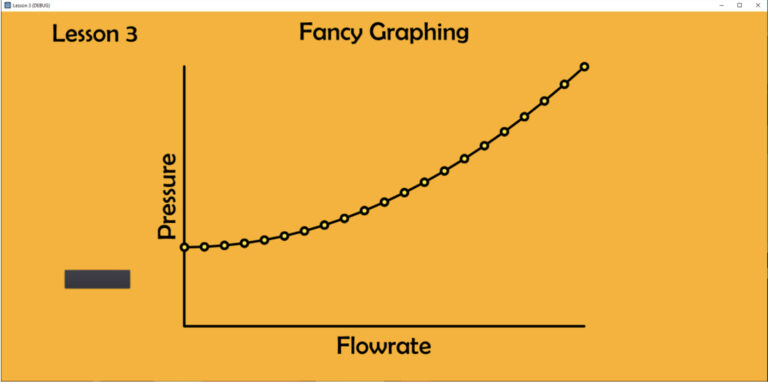
Here is the result:
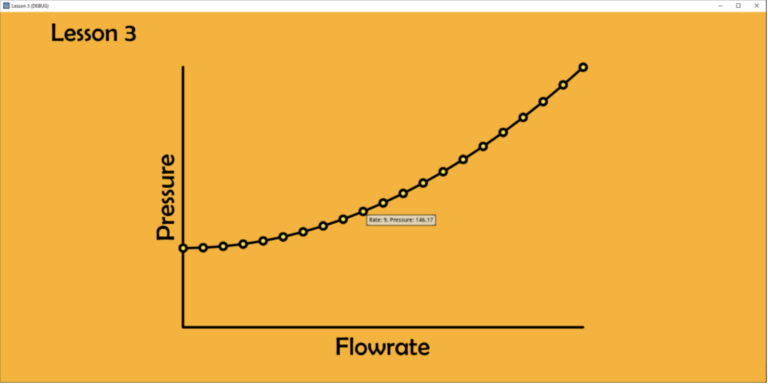
Hover over the data points and you should get a tool-tip with your data displayed.
Next steps: If you wanted to make this more interactive, it would make sense to create another function that re-calculates the pressure and rate arrays, and another one that turns those into the pixel arrays. You could go on from there and add a LineEdit to hold a different C value, or a different number of points, and a button to redraw the whole graph. Don’t forget to use the update() function to replot everything.
But, you wouldn’t want to create makedatapoints again if you had the same number of points. If you needed to get rid of the data point, you could use this to get rid of them.
for i in range(numpoints):
    datapointarray[i].free()
Try adding a button with those two lines that gets rid of all the data points.
Here is all the code:
					extends Node2D

var numpoints
var pressure = []
var rate = []
var xpx = []
var ypx = []

var datapointscene
var datapointarray = []

# Called when the node enters the scene tree for the first time.
func _ready():
    pass # Replace with function body.
    $CanvasLayer#.z_index = -1 #MUST DO THIS With Sprite. Moves the background down a layer so the drawing stuff can be on top of it, not hidden.
    numpoints = 21
    for i in range(numpoints): #this will return 20 values from 0 to 20
        var r = i
        rate.append(r)
        var p = 0.57*pow(r,2)+100.0
        pressure.append(p) #pressure = C*rate^2 plus a separator pressure of 100, where C for this flowline is 0.57, per historical data analysis
    #prints(rate, pressure)
    #What is the max and min of rates and pressures?  Assume minimums are zero.
    var maxx = rate.max()
    var maxy = pressure.max()
    #find conversions of rate and pressure to pixels
    var pixelswide = 1000 #the area of plot is 1000 x 650 pixels
    var pixelstall = 650
    var xoriginpixels = 458  #the origin is 458,788 pixels
    var yoriginpexesl = 788
    var scalex = pixelswide/maxx
    var scaley = pixelstall/maxy


    #loop over rates and pressures and calculate pixel positions
    for i in range(len(rate)):
        var x = xoriginpixels+rate[i]*scalex
        var y = yoriginpexesl-pressure[i]*scaley #negative here because graph is y increasing up, but pixels are y increasing down.
        xpx.append(x)
        ypx.append(y)
    #prints(xpx, ypx)

    #show the data points
    makedatapoints()
    populatedatapoints()

func makedatapoints():
    datapointscene = load("res://datapoint.tscn")
    for i in range(numpoints):
        var datapointinstance = datapointscene.instance()
        add_child(datapointinstance)
        datapointarray.append(datapointinstance)

func populatedatapoints():
    pass
    for i in range(numpoints):
        var tmp = datapointarray[i]
        tmp.position.x = xpx[i]
        tmp.position.y = ypx[i]
        tmp.get_node("TextureRect").hint_tooltip  = "Rate: "+str(rate[i])+", Pressure: "+str(pressure[i])
        #tmp.hint_tooltip  = "Rate: "+str(rate[i])+", Pressure: "+str(pressure[i])


func _draw():
    pass
    var col = Color(0,0,0,1) #Color("000000")
    var rect1 = Rect2(Vector2(500, 500), Vector2(20, 200))
    #draw_rect(rect1, col)
    #draw_line(Vector2(0,0), Vector2(1000,1000), col, 8, true)
    for i in range(len(xpx)-1):
        draw_line(Vector2(xpx[i], ypx[i]), Vector2(xpx[i+1], ypx[i+1]), col, 5, true)


func _on_Button_pressed():
    pass # Replace with function body.
    for i in range(numpoints):
        datapointarray[i].free()
Tip: If you want to create a bunch of different sets of instances, rather than make a special function to create each one, you can make one function and reuse it:
					func makedinstances(loadres, numinstances, array):
    #inputs:
    #loadres is a string like "res://dataeditbox.tscn"
    #numinstances is the integer number of instances you want, like 30
    #array is a simply an array initialized globally (above func _ready) like, var editarray=[]
    #created the resource packed scene referenced by loadres by making a scene (group of nodes)
    #   and doing "Save Branch as Scene", then I deleted it from the root node.
    #   It will be found in the FileSystem because it was saved in the project folder.

    #loads a scene that can be instanced from packed scene
    var scene = load(loadres)
    #there is a two step process, first create an instance and then add the child to the right node (in this case 'self')
    var instance
    for i in range(numinstances):
        instance = scene.instance() #step 1
        add_child(instance) #step 2
        #this is key: to keep track of the buttons, add them to an array of instances
        array.append(instance)
        #you don’t have to ‘return array’ because you are filling the array that is already initialized globally